Vienna Mapping Functions 1 (VMF1)
Reference
+
Reference (forecast)
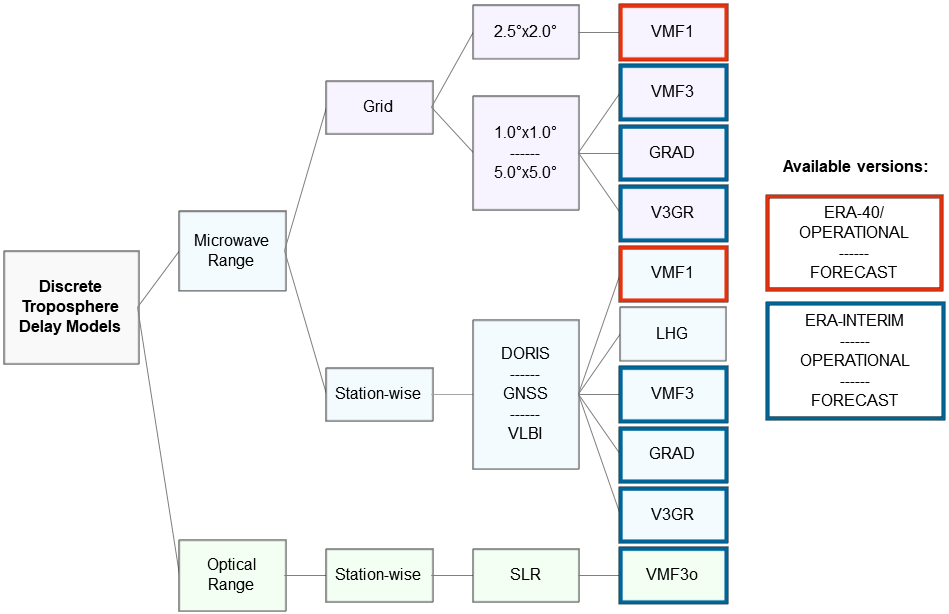
VMF1 is based on empirical equations for the "b" and "c" coefficients of the continued fraction form,
whereas the "a" coefficients are determined epoch-wise (00, 06, 12, 18 UT) from ray-traced delays
at 3° elevation angle. The ray-tracing is performed through two different NWM types,
resulting in two different versions of VMF1. "VMF1_OP" is based on ERA-40 NWMs up to the year 2001
and from the year 2002 onwards on OPERATIONAL NWMs. This version is provided on the day after
the date of its validity. "VMF1_FC" is based on FORECAST NWMs and is provided on the day prior to
the date of its validity.
Important note: The coefficients for determining "c"
in Table 1 of the online paper are incorrect. The corrected table can be found in
this version
of the paper.
Site-wise VMF1
Site-wise VMF1 parameters are provided for DORIS, GNSS, and VLBI stations listed in the respective
*_vmf1.ell file.
Hydrostatic and wet "a" coefficients of VMF1 can be used as input for the routines vmf1.f/vmf1.m
in order to compute the hydrostatic and wet mapping factor.
Important note: On 2018/07/01,
the algorithm for calculating site-wise VMF1 parameters was modified. The values are not determined
for the exact location of a site anymore, but rather are interpolated from the surrounding 2.0°x2.5° grid points.
However, the change in method causes only a slight change of the values.
Important note: Up to 2014/12/1,
parameters for the VLBI station ARECIBO were processed using a wrong longitude.
The value erroneously used was 66° Eastern longitude instead of 66° Western longitude.
Available files:
| DORIS/VMF1/VMF1_OP/*/*.vmf1_d |
VMF1 data for DORIS stations based on ERA-40/OPERATIONAL NWM data (epoch-wise, daily, or yearly format) |
| DORIS/VMF1/VMF1_FC/*/*.vmf1_d |
VMF1 data for DORIS stations based on FORECAST NWM data (epoch-wise, daily, or yearly format) |
| GNSS/VMF1/VMF1_OP/*/*.vmf1_g |
VMF1 data for GNSS stations based on ERA-40/OPERATIONAL NWM data (epoch-wise, daily, or yearly format) |
| GNSS/VMF1/VMF1_FC/*/*.vmf1_g |
VMF1 data for GNSS stations based on FORECAST NWM data (epoch-wise, daily, or yearly format) |
| VLBI/VMF1/VMF1_OP/*/*.vmf1_r |
VMF1 data for VLBI stations based on ERA-40/OPERATIONAL NWM data (epoch-wise, daily, or yearly format) |
| VLBI/VMF1/VMF1_FC/*/*.vmf1_r |
VMF1 data for VLBI stations based on FORECAST NWM data (epoch-wise, daily, or yearly format) |
| codes/vmf1.f |
Fortran code for determining the mapping factors from VMF1 "a" coefficients |
| codes/vmf1.m |
MATLAB code for determining the mapping factors from VMF1 "a" coefficients |
| station_coord_files/doris_vmf1.ell |
List of ellipsoidal DORIS station coordinates used for determining VMF1 parameters |
| station_coord_files/gnss_vmf1.ell |
List of ellipsoidal GNSS station coordinates used for determining VMF1 parameters |
| station_coord_files/vlbi_vmf1.ell |
List of ellipsoidal VLBI station coordinates used for determining VMF1 parameters |
| station_coord_files/orography_ell |
ellipsoidal station heights of the grid points |
Column description:
| (1) |
station name |
| (2) |
modified Julian date |
| (3) |
hydrostatic "a" coefficient |
| (4) |
wet "a" coefficient |
| (5) |
hydrostatic zenith delay [m] |
| (6) |
wet zenith delay [m] |
| (7) |
mean temperature of the atmosphere at the Earth surface corresponding to orography_ell [K] |
| (8) |
pressure at the site [hPa] |
| (9) |
temperature at the site [°C] |
| (10) |
water vapor pressure at the site [hPa] |
| (11) |
orthometric height of the station [m] (using geoid EGM96) |
Grid-wise VMF1
VMF1 values for arbitrary sites can be determined through interpolation from grid-wise VMF1 data. For this purpose,
the routines vmf1_grid.f90/vmf1_grid.m can be used, which also include the transformation of "a" coefficients and
zenith delays from zero height to the desired height. Alternatively, the routines vmf1_ht.f/vmf1_ht.m
can be used for calculating mapping factors from VMF1 "a" coefficients interpolated from the grid.
Available files:
| GRID/2.5x2.0/VMF1/VMF1_OP/*/*.H* |
VMF1 data on a global 2.0°x2.5° grid from OPERATIONAL NWM data (epoch-wise format) |
| GRID/2.5x2.0/VMF1/VMF1_FC/*/*.H* |
VMF1 data on a global 2.0°x2.5° grid from FORECAST NWM data (epoch-wise format) |
| GRID/2.5x2.0/VMF1/STD_OP/*/*.h* |
Compact VMF1 data on a global 2.0°x2.5° grid from OPERATIONAL NWM data (epoch-wise format) |
| GRID/2.5x2.0/VMF1/STD_FC/*.h* |
Compact VMF1 data on a global 2.0°x2.5° grid from FORECAST NWM data (epoch-wise format) |
| codes/vmf1_grid.f90 |
Fortran code for determining mapping factors and zenith delays from VMF1 grid files |
| codes/vmf1_ht.f |
Fortran code for determining mapping factors based on "a" coefficients |
| codes/vmf1_grid.m |
MATLAB code for determining mapping factors and zenith delays from VMF1 grid files |
| codes/vmf1_ht.m |
MATLAB code for determining mapping factors based on "a" coefficients |
| station_coord_files/orography_ell |
ellipsoidal station heights of the grid points |
Column description:
| (1) |
latitude [°] |
| (2) |
longitude [°] |
| (3) |
hydrostatic "a" coefficient |
| (4) |
wet "a" coefficient |
| (5) |
hydrostatic zenith delay [m] |
| (6) |
wet zenith delay [m] |
File description of compact format:
| ah*.h* |
hydrostatic "a" coefficient |
aw*.h* |
wet "a" coefficient |
tm*.h* |
mean temperature of the atmosphere at the Earth surface corresponding to orography_ell [K] |
zh*.h* |
hydrostatic zenith delay [m] |
wh*.h* |
wet zenith delay [m] |
Linear Horizontal Gradients (LHG)
Reference
Complementary to VMF1, the VMF Data Server provides linear horinzontal gradients for the same stations
as VMF1 site-wise products. A reduction factor of 0.53 for the hydrostatic gradients and 0.71 for the wet gradients
needs to be applied. The ellipsoidal coordinates of the stations can be found in the respective *_vmf1.ell files.
Please note that these coordinate files are slightly different from the ones used for VMF3/GRAD.
The provision of LHG gradients ended in 2017. Please refer to the GRAD gradients from then on.
Available files:
| DORIS/LHG/*/*.lhg_d |
LHG data for DORIS stations (daily or yearly format) |
| GNSS/LHG/*/*.lhg_g |
LHG data for GNSS stations (daily or yearly format) |
| VLBI/LHG/*/*.lhg_r |
LHG data for VLBI stations (daily or yearly format) |
| station_coord_files/doris_vmf1.ell |
List of ellipsoidal DORIS station coordinates |
| station_coord_files/gnss_vmf1.ell |
List of ellipsoidal GNSS station coordinates |
| station_coord_files/vlbi_vmf1.ell |
List of ellipsoidal VLBI station coordinates |
Column description:
| (1) |
station name |
| (2) |
modified Julian date |
| (3) |
hydrostatic north gradient [mm] (to be multiplied with 0.53) |
| (4) |
hydrostatic east gradient [mm] (to be multiplied with 0.53) |
| (5) |
wet north gradient [mm] (to be multiplied with 0.71) |
| (6) |
wet east gradient [mm] (to be multiplied with 0.71) |
Vienna Mapping Functions 3 (VMF3)
Reference
VMF3 is the successor of VMF1. It is based on empirical "b" and "c" coefficients of the continued fraction form,
whereas the "a" coefficients are determined epoch-wise (00, 06, 12, 18 UT) from ray-traced delays at 3°
elevation and eight equally spaced azimuth angles. The ray-tracing is performed through different NWM types,
resulting in different versions of VMF3. Furthermore, the extended output format *.v3gr additionally includes
linear horizontal gradients of the GRAD model.
Available versions:
| ERA-Interim ("EI") |
starting in 1980; only published in blocks every few months by the ECMWF, therefore not available in real-time |
| Operational ("OP") |
starting in 2008; made available at about 18 UT for the previous day |
| Forecast ("FC") |
starting in 2018; made available in real-time at about 09 UT for the following day |
Site-wise VMF3
Site-wise VMF3 parameters are provided for DORIS, GNSS, and VLBI stations listed in the respective
*.ell file.
Hydrostatic and wet "a" coefficients of VMF3 can be used as input for the routines vmf3.f90/vmf3.m
in order to compute the hydrostatic and wet mapping factor.
Available files:
| DORIS/VMF3/VMF3_EI/*/*.vmf3_d |
VMF3 data for DORIS stations based on ERA-Interim NWM data (daily or yearly format) |
| DORIS/VMF3/VMF3_OP/*/*.vmf3_d |
VMF3 data for DORIS stations based on OPERATIONAL NWM data (daily or yearly format) |
| DORIS/VMF3/VMF3_FC/*/*.vmf3_d |
VMF3 data for DORIS stations based on FORECAST NWM data (daily or yearly format) |
| GNSS/VMF3/VMF3_EI/*/*.vmf3_g |
VMF3 data for GNSS stations based on ERA-Interim NWM data (daily or yearly format) |
| GNSS/VMF3/VMF3_OP/*/*.vmf3_g |
VMF3 data for GNSS stations based on OPERATIONAL NWM data (daily or yearly format) |
| GNSS/VMF3/VMF3_FC/*/*.vmf3_g |
VMF3 data for GNSS stations based on FORECAST NWM data (daily or yearly format) |
| VLBI/VMF3/VMF3_EI/*/*.vmf3_r |
VMF3 data for VLBI stations based on ERA-Interim NWM data (daily or yearly format) |
| VLBI/VMF3/VMF3_OP/*/*.vmf3_r |
VMF3 data for VLBI stations based on OPERATIONAL NWM data (daily or yearly format) |
| VLBI/VMF3/VMF3_FC/*/*.vmf3_r |
VMF3 data for VLBI stations based on FORECAST NWM data (daily or yearly format); |
| DORIS/V3GR/V3GR_EI/*/*.v3gr_d |
Combined VMF3+GRAD data for DORIS stations based on ERA-Interim NWM data (daily or yearly format) |
| DORIS/V3GR/V3GR_OP/*/*.v3gr_d |
Combined VMF3+GRAD data for DORIS stations based on OPERATIONAL NWM data (daily or yearly format) |
| DORIS/V3GR/V3GR_FC/*/*.v3gr_d |
Combined VMF3+GRAD data for DORIS stations based on FORECAST NWM data (daily or yearly format) |
| GNSS/V3GR/V3GR_EI/*/*.v3gr_g |
Combined VMF3+GRAD data for GNSS stations based on ERA-Interim NWM data (daily or yearly format) |
| GNSS/V3GR/V3GR_OP/*/*.v3gr_g |
Combined VMF3+GRAD data for GNSS stations based on OPERATIONAL NWM data (daily or yearly format) |
| GNSS/V3GR/V3GR_FC/*/*.v3gr_g |
Combined VMF3+GRAD data for GNSS stations based on FORECAST NWM data (daily or yearly format) |
| VLBI/V3GR/V3GR_EI/*.v3gr_r |
Combined VMF3+GRAD data for VLBI stations based on ERA-Interim NWM data (daily or yearly format) |
| VLBI/V3GR/V3GR_OP/*.v3gr_r |
Combined VMF3+GRAD data for VLBI stations based on OPERATIONAL NWM data (daily or yearly format) |
| VLBI/V3GR/V3GR_FC/*.v3gr_r |
Combined VMF3+GRAD data for VLBI stations based on FORECAST NWM data (daily or yearly format) |
| codes/vmf3.f90 |
Fortran code for determining the mapping factors from VMF3 "a" coefficients |
| codes/vmf3.m |
MATLAB code for determining the mapping factors from VMF3 "a" coefficients |
| station_coord_files/doris.ell |
List of ellipsoidal DORIS station coordinates |
| station_coord_files/gnss.ell |
List of ellipsoidal GNSS station coordinates |
| station_coord_files/vlbi.ell |
List of ellipsoidal VLBI station coordinates |
Column description VMF3 data:
| (1) |
station name |
| (2) |
modified Julian date |
| (3) |
hydrostatic "a" coefficient |
| (4) |
wet "a" coefficient |
| (5) |
zenith hydrostatic delay [m] |
| (6) |
zenith wet delay [m] |
| (7) |
pressure at the site [hPa] |
| (8) |
temperature at the site [°C] |
| (9) |
water vapor pressure at the site [hPa] |
Column description V3GR data:
| (1) |
station name |
| (2) |
modified Julian date |
| (3) |
hydrostatic "a" coefficient |
| (4) |
wet "a" coefficient |
| (5) |
zenith hydrostatic delay [m] |
| (6) |
zenith wet delay [m] |
| (7) |
pressure at the site [hPa] |
| (8) |
temperature at the site [°C] |
| (9) |
water vapor pressure at the site [hPa] |
| (10) |
hydrostatic north gradient Gn_h [mm] |
| (11) |
hydrostatic east gradient Ge_h [mm] |
| (12) |
wet north gradient Gn_w [mm] |
| (13) |
wet east gradient Ge_w [mm] |
Grid-wise VMF3
VMF3 values for arbitrary sites can be determined through interpolation from the grid-wise VMF3 data. For this purpose,
the routines vmf3_grid.f90/vmf3_grid.m can be used, which also include the transformation of "a" coefficients and
zenith delays from zero height to the desired height. Alternatively, the routines vmf3_ht.f/vmf3_ht.m
can be used for calculating mapping factors from VMF1 "a" coefficients interpolated from the grid. The grid-wise VMF3 data is
available in a horizontal resolution of 5°x5° as well as 1°x1° for the grid point coordinates listed in gridpoint_coord_5x5.txt and gridpoint_coord_1x1.txt, respectively.
Important note: All VMF3 data on the 5°x5° grid have been re-calculated on May 2, 2018, because wrong ellipsoidal heights had been used for some few grid points before.
Available files:
| GRID/5x5/VMF3/VMF3_EI/*/*.H* |
VMF3 data on a global 5°x5° grid from ERA-Interim NWM data (epoch-wise format) |
| GRID/5x5/VMF3/VMF3_OP/*/*.H* |
VMF3 data on a global 5°x5° grid from OPERATIONAL NWM data (epoch-wise format) |
| GRID/5x5/VMF3/VMF3_FC/*/*.H* |
VMF3 data on a global 5°x5° grid from FORECAST NWM data (epoch-wise format) |
| GRID/1x1/VMF3/VMF3_EI/*/*.H* |
VMF3 data on a global 1°x1° grid from ERA-Interim NWM data (epoch-wise format) |
| GRID/1x1/VMF3/VMF3_OP/*/*.H* |
VMF3 data on a global 1°x1° grid from OPERATIONAL NWM data (epoch-wise format) |
| GRID/1x1/VMF3/VMF3_FC/*/*.H* |
VMF3 data on a global 1°x1° grid from FORECAST NWM data (epoch-wise format) |
| GRID/5x5/V3GR/V3GR_EI/*/*.H* |
Combined VMF3+GRAD data on a global 5°x5° grid from ERA-Interim NWM data (epoch-wise format) |
| GRID/5x5/V3GR/V3GR_OP/*/*.H* |
Combined VMF3+GRAD data on a global 5°x5° grid from OPERATIONAL NWM data (epoch-wise format) |
| GRID/5x5/V3GR/V3GR_FC/*/*.H* |
Combined VMF3+GRAD data on a global 5°x5° grid from FORECAST NWM data (epoch-wise format) |
| GRID/1x1/V3GR/V3GR_EI/*/*.H* |
Combined VMF3+GRAD data on a global 1°x1° grid from ERA-Interim NWM data (epoch-wise format) |
| GRID/1x1/V3GR/V3GR_OP/*/*.H* |
Combined VMF3+GRAD data on a global 1°x1° grid from OPERATIONAL NWM data (epoch-wise format) |
| GRID/1x1/V3GR/V3GR_FC/*/*.H* |
Combined VMF3+GRAD data on a global 1°x1° grid from FORECAST NWM data (epoch-wise format) |
| codes/vmf3_grid.f90 |
Fortran code for determining mapping factors and zenith delays from VMF3 grid files |
| codes/vmf3_ht.f90 |
Fortran code for determining mapping factors based on "a" coefficients |
| codes/vmf3_grid.m |
MATLAB code for determining mapping factors and zenith delays from VMF3 grid files |
| codes/vmf3_ht.m |
MATLAB code for determining mapping factors based on "a" coefficients |
| station_coord_files/gridpoint_coord_5x5.txt |
List of 5°x5° grid point coordinates (based on the model ETOPO5) |
| station_coord_files/gridpoint_coord_1x1.txt |
List of 1°x1° grid point coordinates (based on the model ETOPO5) |
| station_coord_files/orography_ell_5x5 |
Ellipsoidal station heights of the grid points listed in gridpoint_coord_5x5.txt |
| station_coord_files/orography_ell_1x1 |
Ellipsoidal station heights of the grid points listed in gridpoint_coord_1x1.txt |
Column description VMF3 data:
| (1) |
latitude [°] |
| (2) |
longitude [°] |
| (3) |
hydrostatic "a" coefficient |
| (4) |
wet "a" coefficient |
| (5) |
zenith hydrostatic delay [m] |
| (6) |
zenith wet delay [m] |
Column description V3GR data:
| (1) |
latitude [°] |
| (2) |
longitude [°] |
| (3) |
hydrostatic "a" coefficient |
| (4) |
wet "a" coefficient |
| (5) |
zenith hydrostatic delay [m] |
| (6) |
zenith wet delay [m] |
| (7) |
hydrostatic north gradient [mm] |
| (8) |
hydrostatic east gradient [mm] |
| (9) |
wet north gradient [mm] |
| (10) |
wet east gradient [mm] |
A priori horizontal gradients (GRAD)
Reference
Complementary to VMF3, the GRAD model provides hydrostatic and wet horizontal gradients for the same stations
as VMF3 site-wise products, as well as grid-wise data on a 5°x5° and a 1°x1° grid. The gradients are derived from
ray-traced delays, consistently with VMF3 products, and are intended for the gradient formula by
Chen and Herring (1997). The ray-tracing is performed through different NWM types, resulting in different versions of
the GRAD model. Furthermore, the extended output format *.v3gr combines VMF3 and GRAD model parameters.
Available versions:
| ERA-Interim ("EI") |
starting in 1980; only published in blocks every few months by the ECMWF, therefore not available in real-time |
| Operational ("OP") |
starting in 2008; made available at about 18 UT for the previous day |
| Forecast ("FC") |
starting in 2018; made available in real-time at about 09 UT for the following day |
Site-wise GRAD
Site-wise GRAD parameters are provided for DORIS, GNSS, and VLBI stations listed in the respective
*.ell file.
Please note that these coordinate files are slightly different from the ones used for VMF1/LHG.
Available files:
| DORIS/GRAD/GRAD_EI/*/*.grad_d |
GRAD data for DORIS stations based on ERA-Interim NWM data (daily or yearly format) |
| DORIS/GRAD/GRAD_OP/*/*.grad_d |
GRAD data for DORIS stations based on OPERATIONAL NWM data (daily or yearly format) |
| DORIS/GRAD/GRAD_FC/*/*.grad_d |
GRAD data for DORIS stations based on FORECAST NWM data (daily or yearly format) |
| GNSS/GRAD/GRAD_EI/*/*.grad_g |
GRAD data for GNSS stations based on ERA-Interim NWM data (daily or yearly format) |
| GNSS/GRAD/GRAD_OP/*/*.grad_g |
GRAD data for GNSS stations based on OPERATIONAL NWM data (daily or yearly format) |
| GNSS/GRAD/GRAD_FC/*/*.grad_g |
GRAD data for GNSS stations based on FORECAST NWM data (daily or yearly format) |
| VLBI/GRAD/GRAD_EI/*/*.grad_r |
GRAD data for VLBI stations based on ERA-Interim NWM data (daily or yearly format) |
| VLBI/GRAD/GRAD_OP/*/*.grad_r |
GRAD data for VLBI stations based on OPERATIONAL NWM data (daily or yearly format) |
| VLBI/GRAD/GRAD_FC/*/*.grad_r |
GRAD data for VLBI stations based on FORECAST NWM data (daily or yearly format) |
| DORIS/V3GR/V3GR_EI/*/*.v3gr_d |
Combined VMF3+GRAD data for DORIS stations based on ERA-Interim NWM data (daily or yearly format) |
| DORIS/V3GR/V3GR_OP/*/*.v3gr_d |
Combined VMF3+GRAD data for DORIS stations based on OPERATIONAL NWM data (daily or yearly format) |
| DORIS/V3GR/V3GR_FC/*/*.v3gr_d |
Combined VMF3+GRAD data for DORIS stations based on FORECAST NWM data (daily or yearly format) |
| GNSS/V3GR/V3GR_EI/*/*.v3gr_g |
Combined VMF3+GRAD data for GNSS stations based on ERA-Interim NWM data (daily or yearly format) |
| GNSS/V3GR/V3GR_OP/*/*.v3gr_g |
Combined VMF3+GRAD data for GNSS stations based on OPERATIONAL NWM data (daily or yearly format) |
| GNSS/V3GR/V3GR_FC/*/*.v3gr_g |
Combined VMF3+GRAD data for GNSS stations based on FORECAST NWM data (daily or yearly format) |
| VLBI/V3GR/V3GR_EI/*/*.v3gr_r |
Combined VMF3+GRAD data for VLBI stations based on ERA-Interim NWM data (daily or yearly format) |
| VLBI/V3GR/V3GR_OP/*/*.v3gr_r |
Combined VMF3+GRAD data for VLBI stations based on OPERATIONAL NWM data (daily or yearly format) |
| VLBI/V3GR/V3GR_FC/*/*.v3gr_r |
Combined VMF3+GRAD data for VLBI stations based on FORECAST NWM data (daily or yearly format) |
| station_coord_files/doris.ell |
List of ellipsoidal DORIS station coordinates |
| station_coord_files/gnss.ell |
List of ellipsoidal GNSS station coordinates |
| station_coord_files/vlbi.ell |
List of ellipsoidal VLBI station coordinates |
Column description GRAD data:
| (1) |
station name |
| (2) |
modified Julian date |
| (3) |
hydrostatic north gradient Gn_h [mm] |
| (4) |
hydrostatic east gradient Ge_h [mm] |
| (5) |
wet north gradient Gn_w [mm] |
| (6) |
wet east gradient Ge_w [mm] |
Column description V3GR data:
| (1) |
station name |
| (2) |
modified Julian date |
| (3) |
hydrostatic "a" coefficient |
| (4) |
wet "a" coefficient |
| (5) |
zenith hydrostatic delay [m] |
| (6) |
zenith wet delay [m] |
| (7) |
pressure at the site [hPa] |
| (8) |
temperature at the site [°C] |
| (9) |
water vapor pressure at the site [hPa] |
| (10) |
hydrostatic north gradient Gn_h [mm] |
| (11) |
hydrostatic east gradient Ge_h [mm] |
| (12) |
wet north gradient Gn_w [mm] |
| (13) |
wet east gradient Ge_w [mm] |
Grid-wise GRAD
GRAD values for arbitrary sites can be determined through interpolation from the grid-wise GRAD data. For this purpose,
the routines grad_grid.f90/grad_grid.m can be used. The grid-wise GRAD data is available in a horizontal resolution of
5°x5° as well as 1°x1° for the grid point coordinates listed in gridpoint_coord_5x5.txt and gridpoint_coord_1x1.txt,
respectively.
Important note:
All GRAD data on the 5°x5° grid have been re-calculated on May 2, 2018, because wrong ellipsoidal heights had been used for some few grid points before.
Available files:
| GRID/5x5/GRAD/GRAD_EI/*/*.H* |
GRAD data on a global 5°x5° grid from ERA-Interim NWM data (epoch-wise format) |
| GRID/5x5/GRAD/GRAD_OP/*/*.H* |
GRAD data on a global 5°x5° grid from OPERATIONAL NWM data (epoch-wise format) |
| GRID/5x5/GRAD/GRAD_FC/*/*.H* |
GRAD data on a global 5°x5° grid from FORECAST NWM data (epoch-wise format) |
| GRID/1x1/GRAD/GRAD_EI/*/*.H* |
GRAD data on a global 1°x1° grid from ERA-Interim NWM data (epoch-wise format) |
| GRID/1x1/GRAD/GRAD_OP/*/*.H* |
GRAD data on a global 1°x1° grid from OPERATIONAL NWM data (epoch-wise format) |
| GRID/1x1/GRAD/GRAD_FC/*/*.H* |
GRAD data on a global 1°x1° grid from FORECAST NWM data (epoch-wise format) |
| GRID/5x5/V3GR/V3GR_EI/*/*.H* |
Combined VMF3+GRAD data on a global 5°x5° grid from ERA-Interim NWM data (epoch-wise format) |
| GRID/5x5/V3GR/V3GR_OP/*/*.H* |
Combined VMF3+GRAD data on a global 5°x5° grid from OPERATIONAL NWM data (epoch-wise format) |
| GRID/5x5/V3GR/V3GR_FC/*/*.H* |
Combined VMF3+GRAD data on a global 5°x5° grid from FORECAST NWM data (epoch-wise format) |
| GRID/1x1/V3GR/V3GR_EI/*/*.H* |
Combined VMF3+GRAD data on a global 1°x1° grid from ERA-Interim NWM data (epoch-wise format) |
| GRID/1x1/V3GR/V3GR_OP/*/*.H* |
Combined VMF3+GRAD data on a global 1°x1° grid from OPERATIONAL NWM data (epoch-wise format) |
| GRID/1x1/V3GR/V3GR_FC/*/*.H* |
Combined VMF3+GRAD data on a global 1°x1° grid from Forecast NWM data (epoch-wise format) |
| codes/grad_grid.f90 |
Fortran code for interpolating gradients from GRAD grid files |
| codes/grad_grid.m |
MATLAB code for interpolating gradients from GRAD grid files |
| station_coord_files/gridpoint_coord_5x5.txt |
List of 5°x5° grid point coordinates (based on the model ETOPO5) |
| station_coord_files/gridpoint_coord_1x1.txt |
List of 1°x1° grid point coordinates (based on the model ETOPO5) |
Column description GRAD data:
| (1) |
latitude [°] |
| (2) |
longitude [°] |
| (3) |
hydrostatic north gradient Gn_h [mm] |
| (4) |
hydrostatic east gradient Ge_h [mm] |
| (5) |
wet north gradient Gn_w [mm] |
| (6) |
wet east gradient Ge_w [mm] |
Column description V3GR data:
| (1) |
latitude [°] |
| (2) |
longitude [°] |
| (3) |
hydrostatic "a" coefficient |
| (4) |
wet "a" coefficient |
| (5) |
zenith hydrostatic delay [m] |
| (6) |
zenith wet delay [m] |
| (7) |
hydrostatic north gradient Gn_h [mm] |
| (8) |
hydrostatic east gradient Ge_h [mm] |
| (9) |
wet north gradient Gn_w [mm] |
| (10) |
wet east gradient Ge_w [mm] |
Vienna Mapping Functions 3 - optical (VMF3o)
Reference
VMF3o is an adaption of VMF3, dedicated for observations in the optical frequency range (e.g. SLR). It is based on empirical "b" and "c" coefficients of the continued fraction form, whereas the "a" coefficients are determined epoch-wise (00, 06, 12, 18 UT) from ray-traced delays at 5° elevation and eight equally spaced azimuth angles. The ray-tracing is performed through different NWM types, resulting in different versions of VMF3.
Available versions:
| ERA-Interim (_EI) |
starting in 1990; only published in blocks every few months by the ECMWF, therefore not available in real-time |
| OPERATIONAL (_OP) |
starting in 2008; made available at about 18 UT for the previous day |
| OPERATIONAL Forecast (_FC) |
starting in 2019; made available in real-time at about 09 UT for the following day |
Site-wise VMF3o are provided for past and active SLR stations listed in the
slr.ell file.
The subroutine vmf3o_b_c.m can be used for calculating "b" and "c" coefficients of the continuous fraction form,
based on the Spherical Harmonics coefficients saved in anm_*.txt and bnm_*.txt.
VMF3o parameters are designed for a signal wavelength of 532nm. A description and the coefficients of a wavelength correction formula can be found in the file CF_ABC.txt. With this correction formula, VMF3o parameters can be transformed to signal wavelenghts between 350nm and 1064nm. A transformation of "b" and "c" coefficients is not needed, since the effect is absorbed in the correction for the "a" coefficients.
Available files:
| SLR/VMF3o/VMF3o_EI/*/*.vmf3o |
VMF3o data for SLR stations based on ERA-Interim NWM data (daily or yearly format) |
| SLR/VMF3o/VMF3o_OP/*/*.vmf3o |
VMF3o data for SLR stations based on OPERATIONAL NWM data (daily or yearly format) |
| SLR/VMF3o/VMF3o_FC/*/*.vmf3o |
VMF3o data for SLR stations based on FORECAST NWM data (daily or yearly format) |
| codes/CF_ABC.txt |
Description and coefficients of wavelength correction formula |
| codes/vmf3o_b_c.m |
MATLAB code for calculating "b" nd "c" coefficients |
| codes/vmf3o_SH/anm_bh.txt |
Spherical Harmonics coefficients for "b_h" |
| codes/vmf3o_SH/anm_bw.txt |
Spherical Harmonics coefficients for "b_w" |
| codes/vmf3o_SH/anm_ch.txt |
Spherical Harmonics coefficients for "c_h" |
| codes/vmf3o_SH/anm_cw.txt |
Spherical Harmonics coefficients for "c_w" |
| codes/vmf3o_SH/bnm_bh.txt |
Spherical Harmonics coefficients for "b_h" |
| codes/vmf3o_SH/bnm_bw.txt |
Spherical Harmonics coefficients for "b_w" |
| codes/vmf3o_SH/bnm_ch.txt |
Spherical Harmonics coefficients for "c_h" |
| codes/vmf3o_SH/bnm_cw.txt |
Spherical Harmonics coefficients for "c_w" |
| station_coord_files/slr.ell |
List of ellipsoidal SLR station coordinates |
Column description VMF3o data:
| (1) |
station name |
| (2) |
modified Julian date |
| (3) |
hydrostatic "a" coefficient |
| (4) |
wet "a" coefficient |
| (5) |
zenith hydrostatic delay [m] |
| (6) |
zenith wet delay [m] |
| (7) |
pressure at the site [hPa] |
| (8) |
temperature at the site [°C] |
| (9) |
water vapor pressure at the site [hPa] |
| (10) |
hydrostatic north gradient Gn_h [mm] |
| (11) |
hydrostatic east gradient Ge_h [mm] |
| (12) |
wet north gradient Gn_w [mm] |
| (13) |
wet east gradient Ge_w [mm] |